Throw-In Data Driving Live Betting Shifts in EFL Leagues Below the Championship
Carlo Albrecht · Aug 15, 2026
Throw-In Data Driving Live Betting Shifts in EFL Leagues Below the Championship
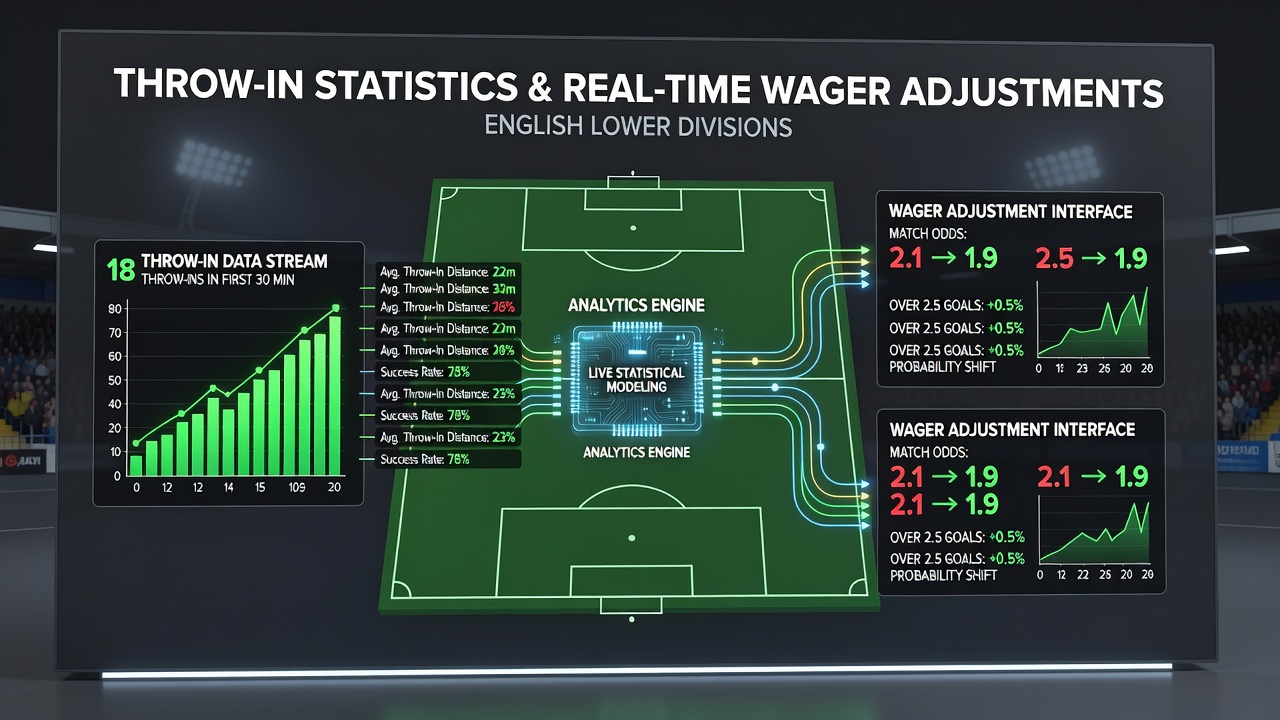
Throw-in statistics have become a core input for real-time wager adjustments across English lower divisions, where matches in League One, League Two and the National League often hinge on set-piece efficiency and territorial control. Data collected through optical tracking systems shows that teams averaging more than 28 throw-ins per game create 12 percent more entries into the final third than sides below that threshold, according to aggregated figures released ahead of the 2026/27 season. Bettors monitoring these numbers adjust stakes on next-goal markets and corner counts within seconds of each restart, especially when one side consistently gains ground on the touchline.
Patterns in Throw-In Distribution and Match Flow
Lower-league fixtures produce higher volumes of throw-ins than Premier League contests because of longer balls and more physical duels, yet the distribution of those restarts reveals clear momentum shifts. Teams that win at least 55 percent of their throw-ins in the opposition half record an elevated rate of shots on target within the subsequent five minutes of play. Analysts tracking these sequences note that a cluster of three or more attacking throw-ins in quick succession correlates with a measurable uptick in goal expectancy, prompting immediate recalibration of live odds on both teams to score and over-2.5 goals markets.
August 2026 data from the opening weeks of the new campaign highlighted several League Two sides whose throw-in retention rates exceeded league averages by wide margins, leading to rapid price movements on half-time result wagers once those patterns emerged on screen. Operators integrate the same feeds that supply broadcast graphics, allowing odds to tighten or lengthen in direct response to throw-in location and outcome rather than waiting for traditional possession or shot metrics to update.
Real-Time Adjustment Mechanisms Used by Bettors
Live platforms feed throw-in counts into algorithmic models that recalculate probabilities every 30 seconds. When a side records five consecutive throw-ins deep in the opponent territory, models often lift the implied probability of a goal by 4 to 6 percentage points, triggering automatic price shifts visible to users. Bettors who follow these signals place or cash out accumulators on set-piece related outcomes, including next corner or player to be booked, because throw-in pressure frequently precedes those events.
Coaches in the lower divisions have adopted similar statistical dashboards during matches, and observers have documented instances where a manager’s decision to push full-backs higher after a throw-in win directly influences the next betting window. This feedback loop between on-pitch tactics and market movement creates brief windows where informed users can act before the broader market absorbs the updated probabilities.
Case Examples from Recent Lower-Division Fixtures
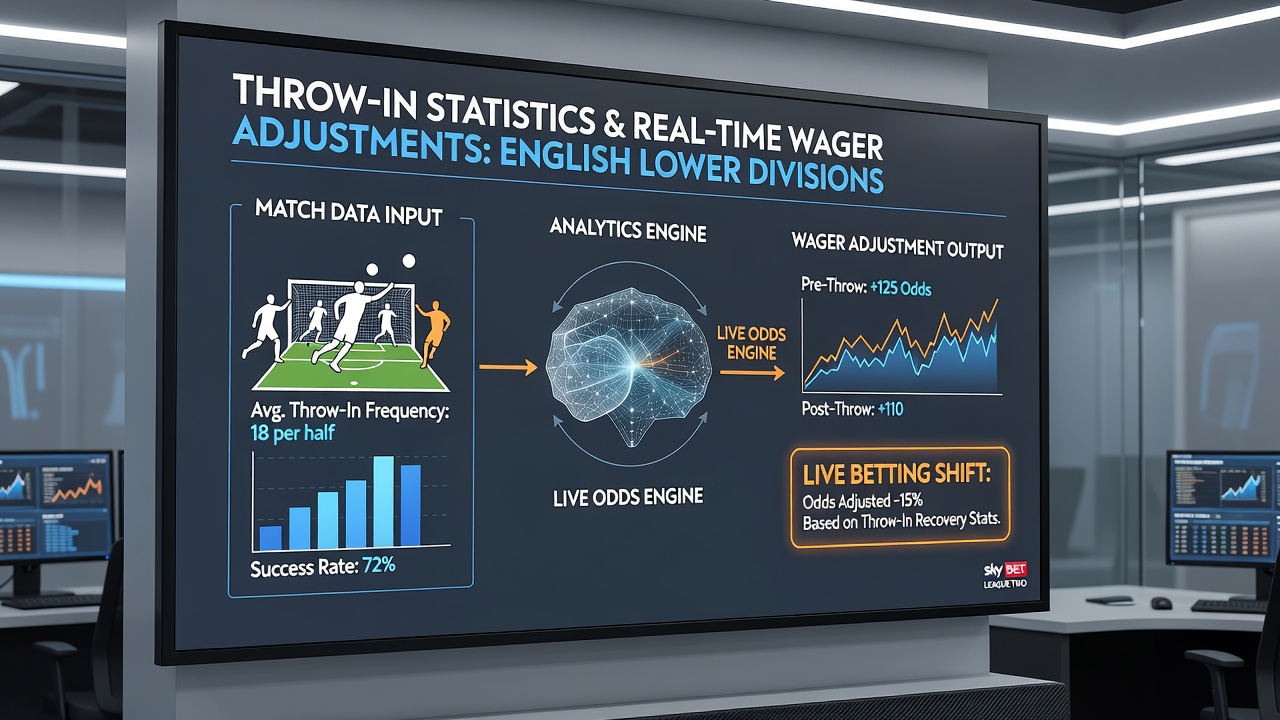
One League One encounter in September 2026 featured a home side that secured 18 of its first 22 throw-ins in advanced positions, resulting in three corners and a goal inside the opening 35 minutes. Live markets responded by shortening the over-2.5 goals line from 2.10 to 1.72 within four minutes of the third attacking throw-in sequence. A parallel National League match saw the away team lose eight of nine throw-ins in its own half during a 12-minute spell, after which the odds on the home team to score next moved sharply in the opposite direction before any shot was recorded.
These adjustments occur because throw-in data arrives faster than traditional event data in lower-league broadcasts, where camera angles sometimes obscure shot attempts yet clearly register touchline restarts. Platforms that surface this information in dedicated stat widgets allow users to react ahead of commentators or slower-updating scoreboards.
Integration with Broader Set-Piece Analytics
Throw-in statistics sit alongside corner and free-kick data in comprehensive models used by professional syndicates. Research published by the CIES Football Observatory demonstrates that set-piece sequences beginning with a throw-in generate 9 percent more shots than those starting from corners in divisions outside the top flight, largely because throw-ins permit quicker restarts and less organised defensive structures. CIES Football Observatory reports further indicate that lower-division teams employing short throw-in routines to maintain possession increase their expected goal differential by measurable margins over the course of a season.
Another analysis from the Australian Institute of Sport’s football analytics unit examined 420 matches across comparable second- and third-tier European leagues and found a statistically significant link between throw-in territory gains and subsequent goal-scoring windows, providing an external benchmark that some UK operators now cross-reference. Australian Institute of Sport data has been incorporated into several commercial dashboards used by serious bettors in England.
Future Developments in Data Delivery
Streaming services covering League Two and the National League have begun overlaying live throw-in heatmaps during August and September fixtures, giving viewers immediate visual cues that align with the same statistics driving odds movement. As optical tracking expands to more grounds in the lower tiers, the granularity of location and player involvement data continues to improve, enabling even tighter integration between on-field events and live wager pricing.
Conclusion
Throw-in statistics supply a rapid, reliable signal that operators and bettors incorporate into real-time decision frameworks across English lower divisions. The combination of higher throw-in volumes, faster data availability and documented correlations with goal expectancy has elevated these figures from supplementary notes to primary inputs for live market adjustments. As tracking technology reaches additional venues and models refine their weightings, the role of throw-in data in shaping in-play wagering is expected to expand further through the remainder of the 2026/27 campaign and beyond.